
Broadcom Seasonality: 17 Straight Years Up, Oct to Jan
Broadcom (AVGO) has closed higher between October 8 and January 15 in every one of the last 17 years. Not most years. Every one. This year's window opens on October 8, 2026 and closes on January 15, 2027.
A perfect record is exactly when you should look harder, so here is what the numbers in SuperSeasonals show, including the parts an average hides.
The window at a glance
- Window: Oct 8 to Jan 15, about 68 trading days
- Track record: higher in 17 of 17 years, with data since 2009
- Average move: +15.49% (median +13.22%)
- Smallest gain: +1.65%, in the window that closed in January 2013
- Biggest gain: +32.15%, in the window that closed in January 2014
- Last five windows: higher every time, with an average move of +21.95%
The last five years, side by side
Each line below is one year's path through the same calendar window. The dashed line marks the exit, 68 trading days after entry.
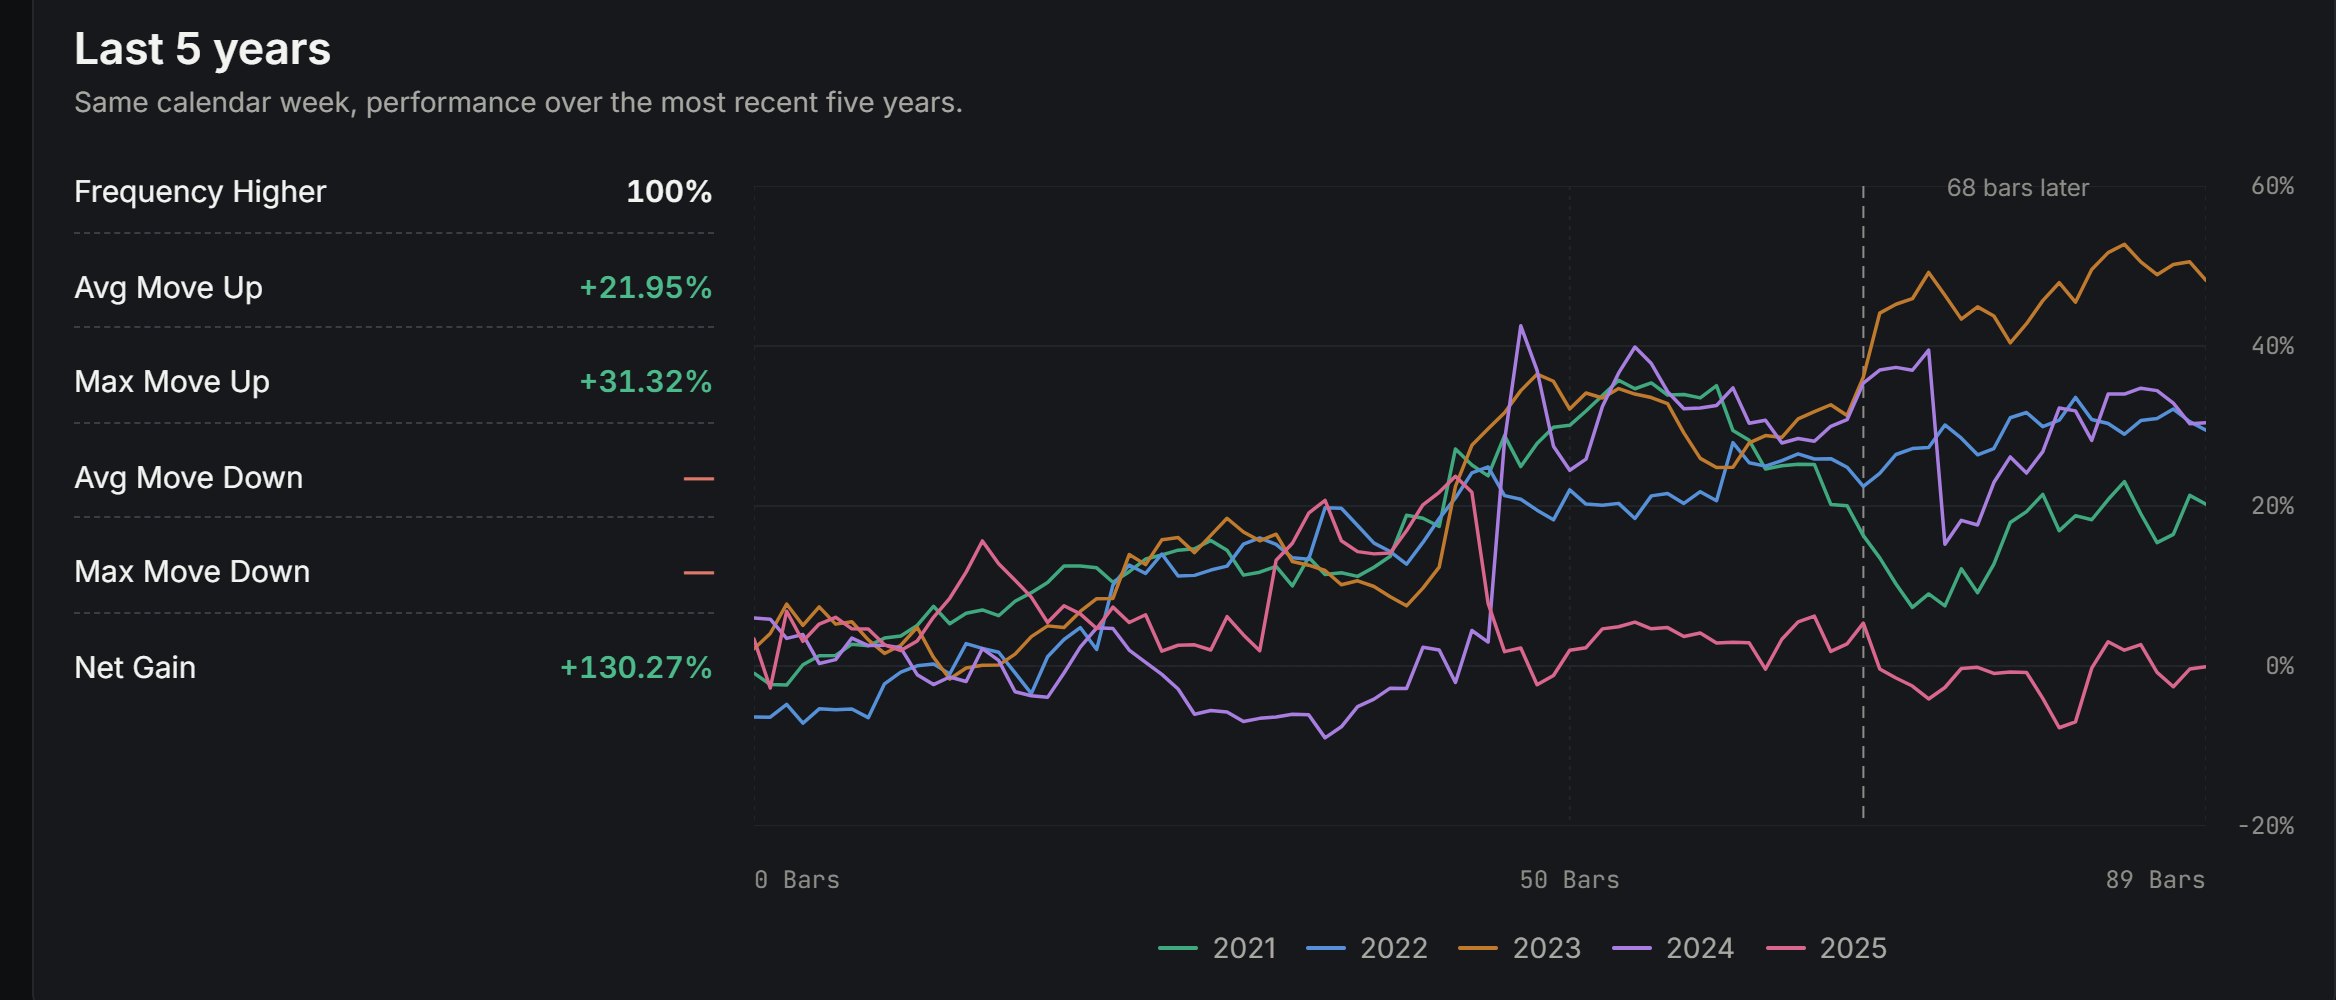
The pattern holds, but the paths are not smooth. Some years were up more than 30% at the exit. The window that closed in January 2026 finished only 2.76% higher.
Every year, not just the average
This is the yearly breakdown from the AVGO report, with the entry price, the high and low reached inside the window, and the exit date for each year.
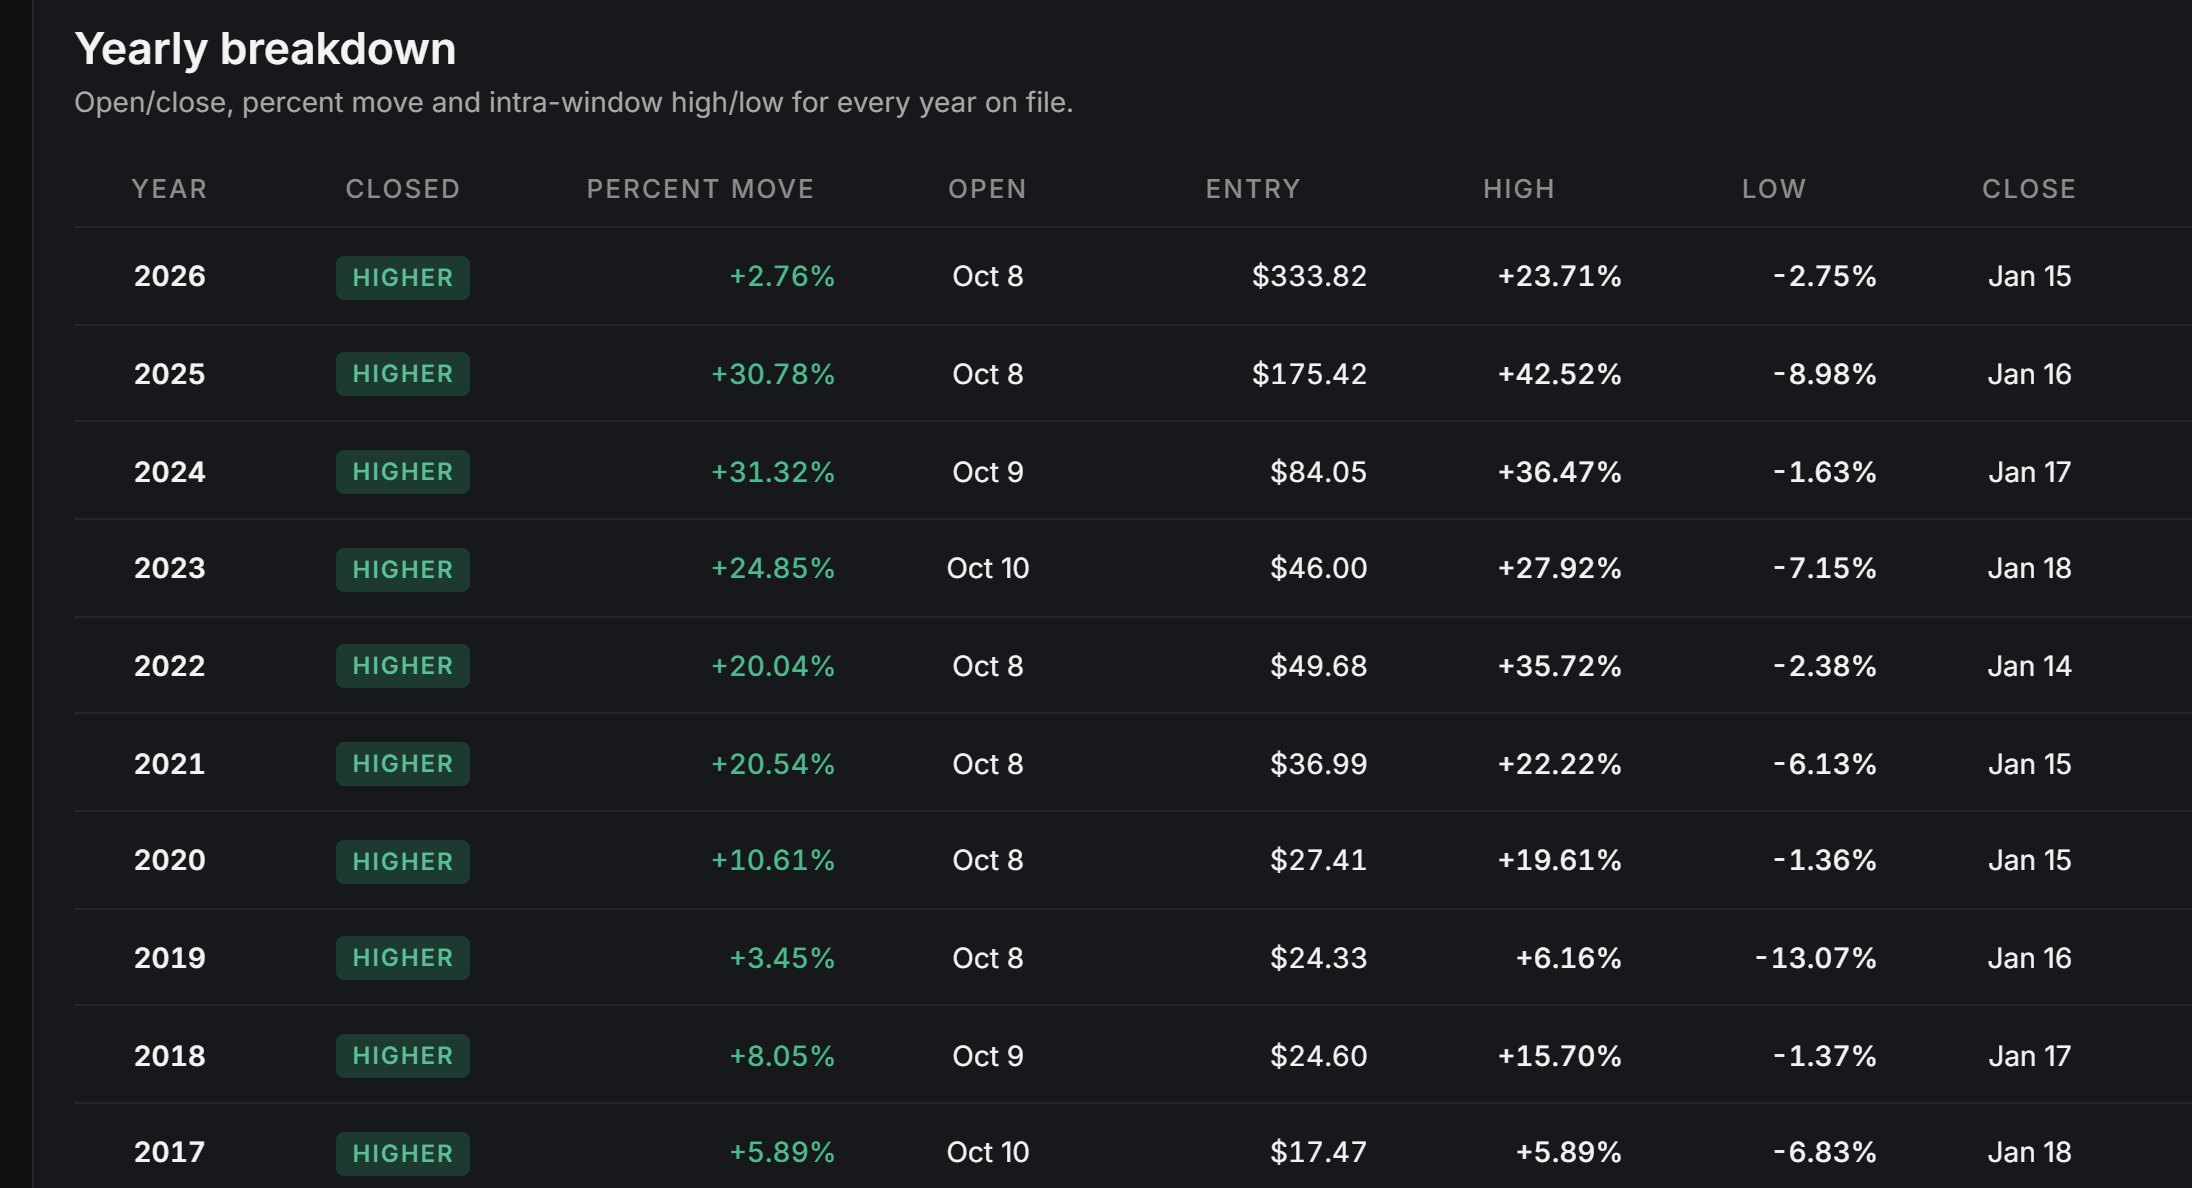
Two things stand out:
- The gains vary a lot. The windows that closed from 2021 to 2025 gained 20% to 31%. The one that closed in January 2026 gained 2.76%, and earlier ones gained as little as 1.65%.
- Ending higher doesn't mean a smooth ride. On average, the worst point inside the window was 6.52% below entry, and the deepest was 16.52%. In the window that closed in January 2019, AVGO was down 13.07% at one point and still finished 3.45% higher.
How to read a window like this
Before acting on any seasonal pattern, check four things. SuperSeasonals shows all of them on the report:
- Frequency and years of data. 17 of 17 is strong. 17 years is a solid sample, not an unlimited one.
- The worst year. Here even the worst year was a gain.
- The dips inside the window. Know how far it has fallen before it recovered, not just where it ended.
- The context. AVGO is a Technology stock in the Semiconductors industry. Check whether anything this year could break the pattern.
New to seasonality charts? Watch how to read one in a few minutes.
This year's window
AVGO's window opens on October 8, 2026 and closes on January 15, 2027. You can see the full report, set an alert for the entry date, and find the other windows opening the same week in SuperSeasonals. See plans.
Data as of September 26, 2026. Seasonal patterns describe the past and don't guarantee future results. This is not investment advice.